Connected Papers is a visual literature-discovery tool that creates a graph of publications related to a paper you already know. It is designed for researchers who want to move beyond keyword searching and see how a paper fits within a wider body of work.
This Connected Papers review examines how the graphs work, what the Prior Works and Derivative Works views reveal, where the tool belongs in a literature review, and what it cannot do.
Connected Papers is particularly helpful when you have found one strong article and want to locate neighbouring research quickly. It does not summarize papers, extract evidence, manage citations, or write a literature review. Its purpose is narrower: it helps researchers discover publications that are intellectually or bibliographically connected.
What Is Connected Papers?
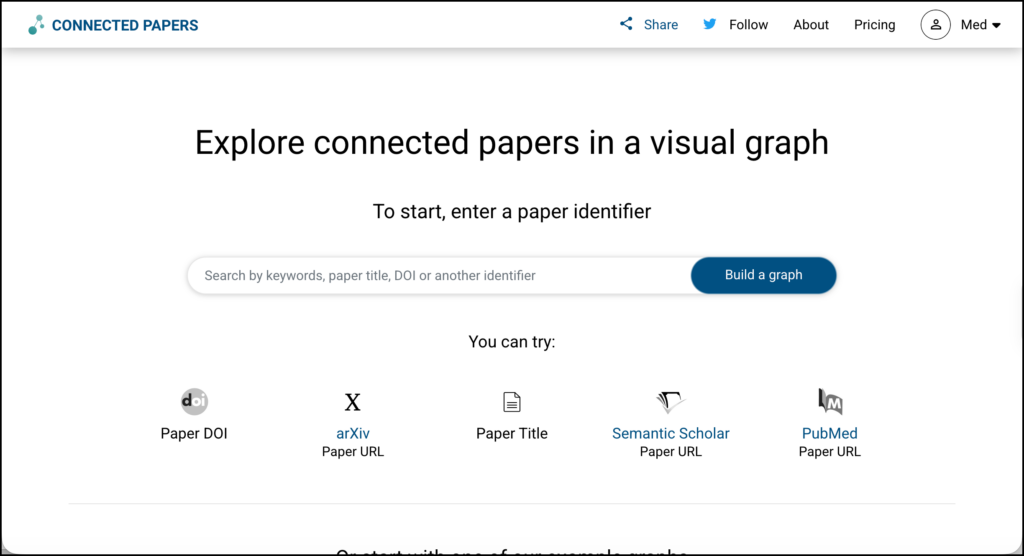
To begin, you enter a paper title, DOI, URL, or another identifier. Connected Papers uses the selected publication as an “origin paper” and creates a graph of related academic work.
The graph is based on the Semantic Scholar paper corpus. For each graph, the platform says it analyses approximately 50,000 candidate publications and selects a few dozen with the strongest relationships to the origin paper.
These relationships are calculated primarily through two concepts:
- Co-citation: Two papers are related when later publications frequently cite them together.
- Bibliographic coupling: Two papers are related when they cite many of the same sources.
This means that two papers can appear close together even if neither directly cites the other. The graph is a similarity map, not a conventional citation tree.
How to Read a Connected Papers Graph
Each circle represents a paper. The origin paper is marked separately so that you can locate it within the surrounding literature.
The visual properties carry different meanings:
- Papers positioned close together are more similar according to the platform’s citation-based calculation.
- Larger circles generally indicate papers with more citations.
- Colour represents publication year, helping distinguish older from newer work.
- Lines indicate stronger similarity relationships among the displayed publications.
These signals should be read cautiously. A large circle shows citation visibility, not methodological quality. An older paper has had more time to accumulate citations than a recent publication. A close relationship means the papers share citation patterns; it does not mean their findings agree.
Main Connected Papers Features
Similar-paper graph
The main graph provides a quick overview of publications surrounding the origin paper. It can reveal clusters, influential publications, and changes in a research area over time.
This is useful when a field uses several names for the same idea. A paper can appear in the graph because of its citation relationships even when its title does not contain the keywords used in your original database search.
Prior Works
The Prior Works view identifies older publications frequently cited by papers in the graph. These are possible foundational or “ancestor” papers for the research area.
Prior Works can help locate:
- Foundational theories
- Original methods and instruments
- Early empirical studies
- Publications that established a line of inquiry
- Older work repeatedly cited by later researchers
The list still needs to be examined carefully. A frequently cited paper may be included as a standard reference without directly supporting the specific claim being investigated.
Derivative Works
Derivative Works identifies newer papers that cite several publications in the graph. This view can reveal later studies, reviews, and publications that developed after the origin paper.
It is useful for finding:
- Recent literature reviews
- Follow-up studies
- Replications
- Applications in new contexts
- Later work combining several branches of the literature
Connected Papers specifically presents Derivative Works as a way to find later work and more recent state-of-the-art publications.
Multi-origin graphs
A graph can be refined by adding further origin papers. You begin with one paper, select another node in the resulting graph, and add it as an additional origin.
The new graph favours papers related to all selected origins. This can help narrow an overly broad graph or explore the intersection between two related concepts.
For example, a researcher could begin with a paper about automated feedback, then add another concerning feedback literacy. The revised graph may surface studies connecting the two areas.
Multi-origin graphs are included in the free and paid plans.
Graph and list views
The graph provides visual orientation, while the list view makes it easier to scan publication details. Researchers can inspect titles, authors, years, citation counts, and other available metadata.
The list is often more practical during screening. A visually prominent node may attract attention, but relevance should be determined from the title, abstract, and full text.
Saved papers and graph history
Account holders can save papers and revisit previously generated graphs. This helps when exploring several branches of a topic.
These features are lighter than a full reference manager. Connected Papers should not become the only place where a researcher stores included studies, PDFs, notes, or screening decisions.
Mobile browser support
Connected Papers can be used in mobile browsers, although citation graphs are easier to inspect on a larger screen. A laptop or desktop is preferable when comparing clusters and opening several publications.
How to Use Connected Papers for Research
Connected Papers is most helpful as a supplementary discovery tool. The following workflow places it alongside database searching, reference management, and critical appraisal.
1. Define the research question
Begin with a focused question. For example:
How does AI-generated feedback affect revision quality among undergraduate second-language writers?
Identify the central concepts:
- AI-generated feedback
- Revision quality
- Second-language writing
- Undergraduate students
Write preliminary inclusion criteria before generating a graph. These criteria will help you distinguish relevant recommendations from papers that are merely interesting.
2. Find a reliable origin paper
The graph depends heavily on the paper selected at the beginning. Choose an origin paper that is closely aligned with the research question.
A useful origin might be:
- A recent systematic or scoping review
- A highly relevant empirical study
- A foundational theoretical paper
- A recent publication with a substantial reference list
Avoid selecting a paper because it appears first in a search result. Read the abstract and check the methodology, population, and publication details.
The best origin paper is not necessarily the most highly cited one. It is the paper that most accurately represents the part of the literature you need to explore.
3. Generate the first graph
Enter the title or DOI and confirm that Connected Papers has identified the correct publication. Papers sometimes have similar titles, and preprints may coexist with published versions.
Generate the graph and locate the origin paper. Before clicking individual nodes, look at the graph as a whole:
- Are there visible clusters?
- Is the origin paper central or peripheral?
- Does the graph span several decades?
- Are a few older papers much larger than the rest?
- Is there a separate group of recent publications?
These observations should become questions for further searching. They are not conclusions about the literature.
4. Screen the graph systematically
Move through the papers using the list view. For each potentially relevant publication, record:
- Full citation
- Relevance to the research question
- Population and setting
- Likely research design
- Reason for saving or excluding it
- Whether the full text has been retrieved
Do not save every paper in the graph. A publication can be structurally similar to the origin paper while falling outside the review’s scope.
For the example question, a paper about automated feedback in professional journalism might share references with studies of student writing but involve the wrong population.
5. Explore Prior Works
Open the Prior Works view and look for publications that appear to support several papers in the graph.
Retrieve the most relevant ones and ask:
- Did this paper introduce a major concept?
- Is it the original source for an instrument or model?
- Are later authors citing it accurately?
- Does it still support the claims currently attached to it?
- Has the theory changed through later interpretations?
This step helps avoid “citation inheritance,” where a claim is repeated across papers even though few authors have checked the original source.
6. Explore Derivative Works
Use Derivative Works to move forward from the graph. Pay particular attention to recent reviews and papers that cite several graph publications.
This view can help locate work published after the origin paper. If the origin is from 2022, Derivative Works may reveal studies from 2024, 2025, or 2026 that tested the idea in new contexts.
Check whether the newer papers:
- Replicate the original study
- Use a different population
- Challenge its assumptions
- Apply another methodology
- Report contradictory findings
- Combine previously separate areas
A later publication should not be treated as better simply because it is newer. Its methods and evidence still need appraisal.
7. Build a multi-origin graph
Select a second paper that represents an important dimension missing from the first graph.
For example, the initial graph may focus heavily on automated writing evaluation. Adding a paper specifically about feedback literacy can refine the search toward studies connecting automated feedback with students’ ability to interpret and act on feedback.
A third origin could represent the target population, such as undergraduate second-language writers.
Add origins deliberately. Each one changes the meaning of the search. Keep a short record of which papers were used and why.
8. Generate more than one independent graph
One graph reflects one starting point, even when additional origins are added later. To reduce seed bias, create separate graphs from different types of papers:
- A recent review
- A foundational theoretical publication
- A recent empirical study
- A paper from another discipline
- A study conducted in a different geographical context
Compare the results. Papers appearing across several independent graphs deserve closer examination, though repeated appearance is still not a measure of research quality.
Separate graphs can also expose different scholarly communities that rarely cite one another.
9. Compare the results with database searches
Run a structured search in relevant databases. For education research, this may include ERIC, PsycINFO, Scopus, and Web of Science.
Compare the results with the Connected Papers graphs:
- Which database results are absent from the graphs?
- Which graph papers were missed by the keywords?
- Are newer studies poorly represented?
- Are books, reports, or regional journals missing?
- Does one country or research group dominate the graph?
Citation-based discovery can locate papers missed by keywords, but it can also overlook publications with sparse citation data. Using both approaches provides better coverage.
10. Transfer papers to a reference manager
Move promising papers into Zotero, EndNote, Mendeley, or another reference manager. Connected Papers does not provide the same library, annotation, attachment, and word-processor functions as a dedicated citation manager.
Check all imported or copied details:
- Author names
- Publication year
- Article title
- Journal information
- DOI
- Version of record
- Page range
Create tags showing where each paper came from, such as Connected Papers—Graph 1 or Derivative Works. This leaves an audit trail when several discovery methods are combined.
11. Evaluate the papers themselves
The graph tells you that publications are related. It does not tell you whether their methods are sound or their conclusions justified.
For each paper considered for inclusion, evaluate:
- Research design
- Sample and recruitment
- Measures and instruments
- Data analysis
- Findings
- Limitations
- Funding and conflicts of interest
- Relevance to the research question
Keep this information in an evidence matrix. Connected Papers is a source-discovery tool, not an evidence-extraction platform.
12. Document the process for formal reviews
For a systematic or scoping review, record:
- Origin paper or papers
- Date each graph was generated
- Views used
- Screening criteria
- Number of papers examined
- Number transferred to full-text screening
- Reasons for exclusion
Connected Papers should normally be reported as a supplementary citation-searching method. It should not be presented as the sole search strategy for a comprehensive review.
Connected Papers Pricing
Connected Papers has Free, Academic, Business, Group, and Academic Library options.
The official pricing page currently confirms that the free plan includes all features with a limit of five graphs per month. It displays academic pricing from US$6 per month, although prices may vary by billing arrangement or account location. Academic and Business plans include unlimited graphs, and separate arrangements are available for groups and libraries.
| Plan | Current structure | Intended users |
|---|---|---|
| Free | Five graphs per month; all main features included | Occasional research and initial exploration |
| Academic | Paid plan with unlimited graphs | Academics, students, non-profits, and personal research |
| Business | Paid plan with unlimited graphs | Commercial and industry research |
| Group | Per-seat licensing and centralized billing | Research teams and organizations |
| Academic Library | Custom quote with institutional access options | Colleges and universities |
Because the pricing page is dynamically displayed and may show different regional or annual rates, confirm the final price at checkout.
Connected Papers Compared with Similar Tools
| Tool | Best use | Main strength | Important limitation |
|---|---|---|---|
| Connected Papers | Fast visual orientation from a known paper | Simple similarity graph with Prior and Derivative Works | Limited research organization and no monitoring |
| ResearchRabbit | Iterative discovery across growing collections | Collections, author exploration, collaboration, and continuing searches | Requires more setup than a one-paper graph |
| Litmaps | Citation mapping and research monitoring | Configurable searches, alerts, and Zotero Sync | Advanced functions require Pro |
| Elicit | Screening and evidence extraction | Structured study-comparison tables | Citation mapping is not its primary purpose |
| SciSpace | Reading and questioning full papers | PDF chat, extraction, and writing support | Generated answers require careful checking |
Connected Papers is the quickest of these tools when you have one useful paper and want an immediate view of nearby research. ResearchRabbit and Litmaps are better suited to a map that grows with a long-term project.
Privacy, Verification, and Limitations
Connected Papers relies on the Semantic Scholar corpus, so its coverage depends on the records and citation information available there. Missing publications or citation links can create misleading gaps.
The privacy policy explains how personal and usage information is collected when users create accounts and use the website. Researchers should consult it before saving work connected to a sensitive or confidential project. The service is primarily built around public bibliographic metadata; it does not need participant data or unpublished research records to generate a graph.
Avoid placing confidential information in saved-paper labels or account features. The tool does not need identifiable research data to perform its core function.
The larger limitation is seed dependence. A narrowly framed or methodologically weak origin paper can generate a graph that appears coherent while representing only one corner of the field. Multiple origins, independent graphs, and database cross-checking are essential.
Connected Papers also lacks built-in critical appraisal, full-text synthesis, evidence extraction, and ongoing topic alerts. It helps find papers. Everything that determines the quality of the review happens afterward.
Final Assessment
Connected Papers is one of the simplest ways to explore the literature around a known publication. The graph is easy to understand, while Prior Works and Derivative Works provide useful paths backward and forward through a field.
I would use it early in a project, after finding one or two reliable papers, and again later to check whether important surrounding work has been missed. I would not use it as the only search method or as evidence that a literature review is complete.
Its role is clear: Connected Papers helps researchers identify where to look. Reading, evaluating, organizing, and synthesizing what they find remain the researcher’s work.
Sources
- Connected Papers official website
- About Connected Papers
- Connected Papers pricing
- Connected Papers privacy policy
- Connected Papers terms of service
- Connected Papers cookie policy